
Mapping Socio-Ecological Change in the Red Corridor using GIS
Collaborators: Diana Moanga
Course project done as part of EARTHSYS144: Introduction to GIS, Winter 2025-26 quarter.
Motivation
Central India consists mainly of forests and mountains, and is rich in natural resource deposits, specifically coal mines, iron ore, and aluminium ore (Bauxite). Over the years after Indian independence, large swathes of these lands have been handed over to foreign MNCs, which have resulted in the indigenous people being forcefully displaced, and also caused great ecological damage. The constant repression of the people by the state machinery have also resulted in there being maoist activity in these areas, and hence, these regions are very conflict-prone. There is very little media coverage of these areas.
Drawing inspiration from how GIS has been used to quantify and study conflict in Palestine and Sudan, is it possible for us to use openly available satellite footage to study socio-ecological changes in the region?
Methodology
We identify Areas of Interest (AoIs) by leveraging prior literature on mining-related conflict in India, which suggests that regions surrounding mineral extraction sites are likely hotspots of conflict. Using district-level Maoist conflict data from the South Asia Terrorism Portal (SATP), we first identify regions with historical conflict activity. We then overlay open-source geospatial datasets of iron ore, bauxite, and coal mine locations to examine the spatial relationship between mining activity and conflict. Buffer regions around these mines are subsequently defined as AoIs for remote sensing analysis, enabling comparison between conflict-affected and non-conflict mining regions.
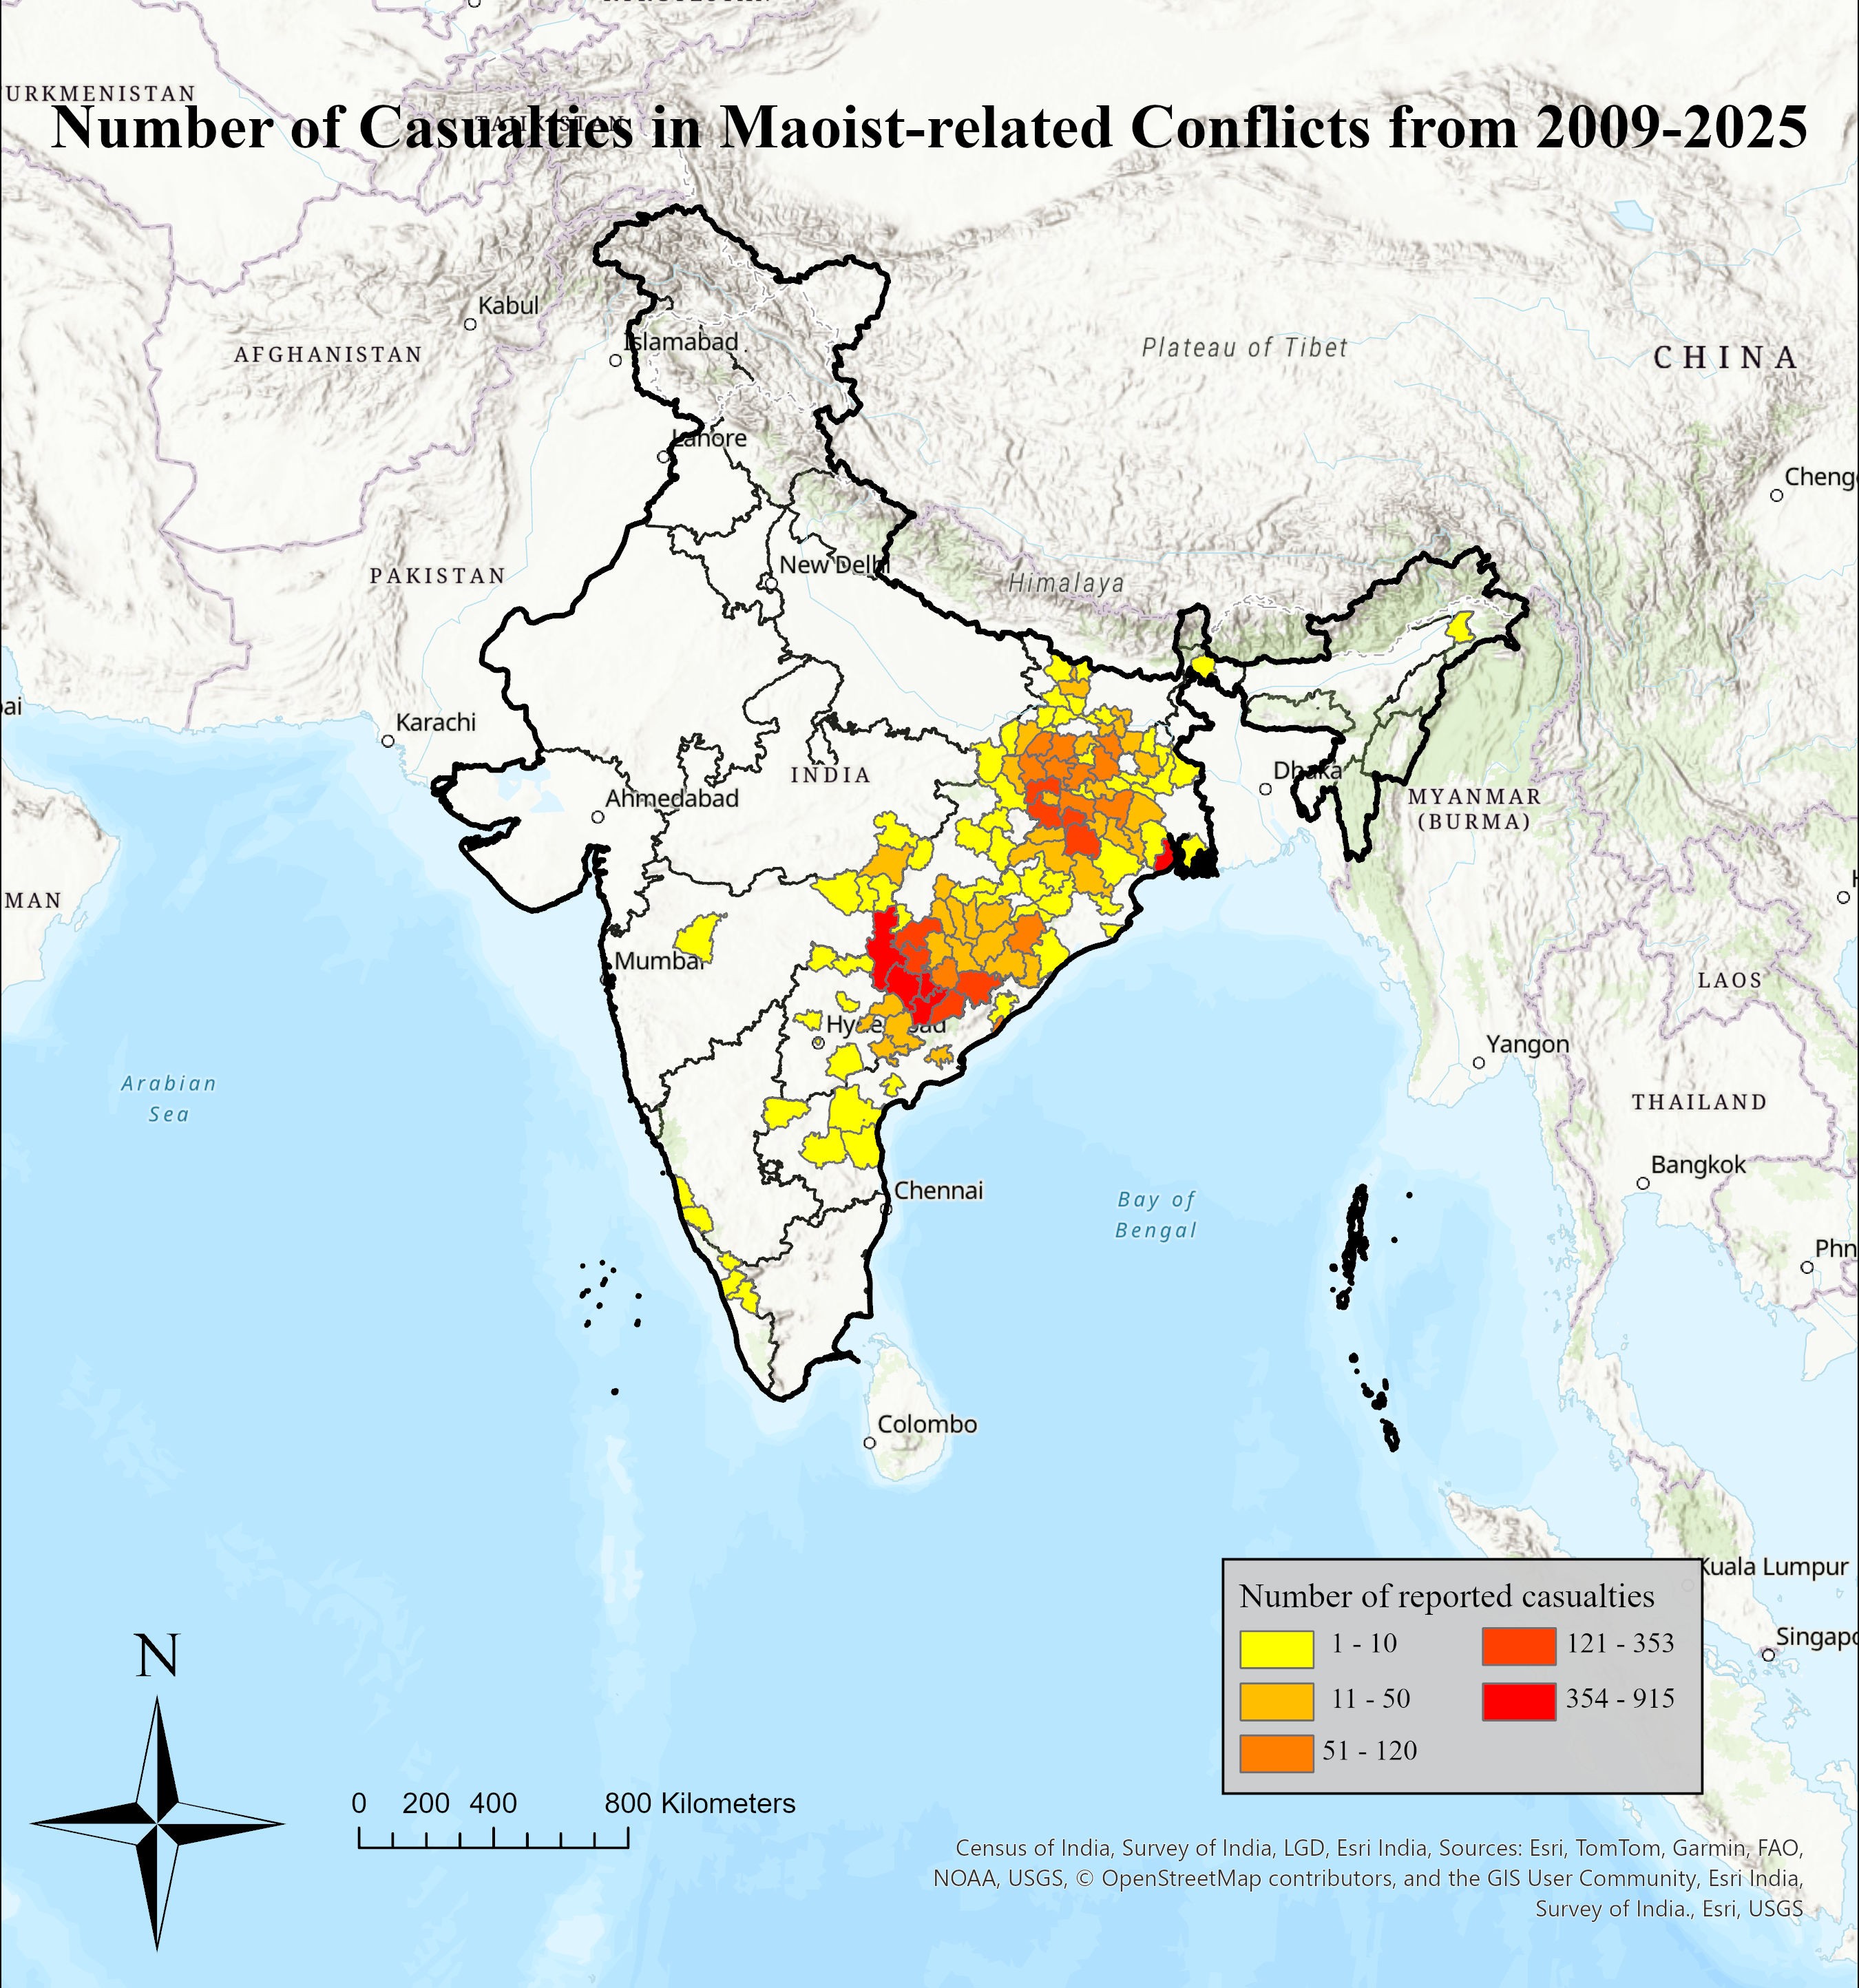 Figure 1: Map showing conflict areas, created using data from SATP
Within these AoIs, we analyze temporal changes in ecological and human activity using multi-year satellite datasets. Land degradation and ecological impacts are studied using Landsat-8 Level-2 imagery, while changes in human presence and potential displacement are examined using VIIRS nighttime light data. To efficiently process large-scale raster time series, including automated cloud filtering, image selection, and spatial clipping, we utilize Google Earth Engine (GEE), which provides scalable access to and processing of satellite imagery. This is what our outputs look like:
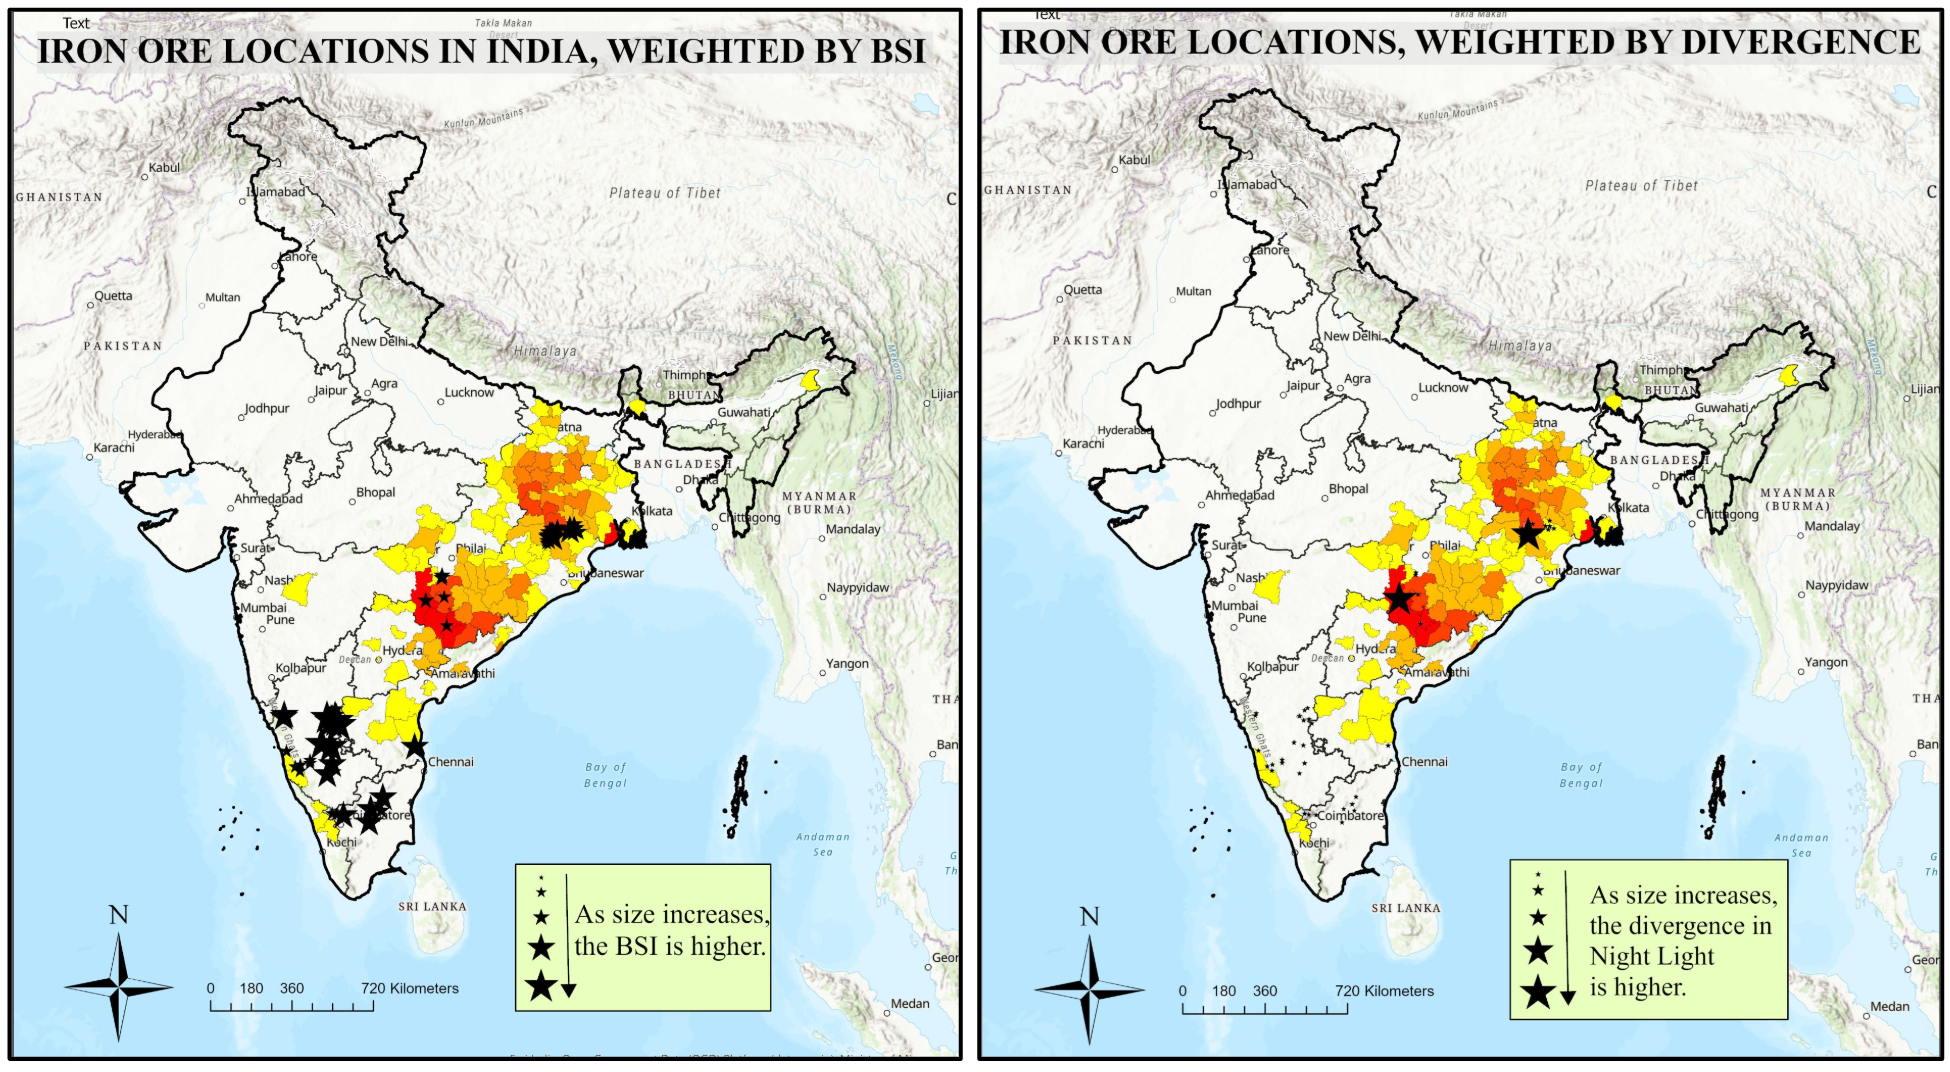
*Figure 2: On the left map, we see that iron ores with higher BSI (lower vegetation, which implies larger ecological damage), generally occur in areas under maoist control instead of state control. Further, on the right map, we see that there is a significant night-light divergence in conflict zones, hinting at the people being displaced.
While the results themselves are not too strong, I believe this is largely because we are using open-source satellite data which is not very high resolution. Even with that, we have obtained some interesting findings, and I believe that the methodology and the approach to this problem can be helpful to look into. I will soon make the data and code available here. For more details, check the presentation linked below.